visual analytics for decision automation
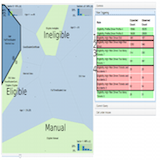
2008-2013 This project aims at applying visual analytics techniques to address some well-identified challenges of Business Rules Management Systems. Those challenges involve providing business users with tools to better understand the structure and properties of the business rules system they design, and leveraging analytics tools to better anticipate emerging effects among massive automated decision systems. I worked with Frank van Ham and co-advised Bertjan Broeksema's PhD thesis at the IBM France Lab. Some published results:
- Decision Exploration Lab: Eligibility demo. Scientific Video.
- The decision exploration lab. B. Broeksema, University of Groningen, PhD Thesis.
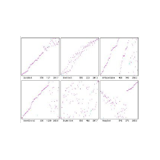
- Visual Analysis of Multi‐Dimensional Categorical Data Sets B Broeksema, AC Telea, T Baudel. Computer Graphics Forum 32 (8), 158-169
- Decision exploration lab: A visual analytics solution for decision management B Broeksema, T Baudel, A Telea, P Crisafulli Visualization and Computer Graphics, IEEE Transactions on 19 (12), 1972-1981
- Capturing the Design Space of Sequential Space-Filling Layouts. Baudel, T & Broeksema, B, IEEE Transactions on Visualization and Computer Graphics, Volume: 18 , Issue: 12 Page(s): 2593 - 2602.
- Contextual feedback of rules proximity based upon co-occurence history in a collaborative rule editing system. Baudel, T. Van Ham, F. US Patent 8805771.
- Rule correlation to rules input attributes according to disparate distribution analysis. Baudel, T. Van Ham, F. US Patent 8825588.
- At Bertjan's PhD defense, with Jean-Daniel Fekete.
ilog discovery
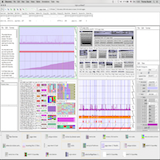
2002-2008 In the 80's, the spreadsheet revolutionized the world of data analytics. However, its interaction model doesn't scale when available datasets grow by order of magnitudes. ILOG Discovery provides means to visualize and manipulate very large datasets interactively. It defines a formal visualization model called "data-linear visualizations", which can be compared to the relational model of databases, and leverages this model to allow interactive construction of visualizations, as well as means to reverse the model to provide means to edit data through the inverse operators.
- Browsing through an Information visualization design space. Scientific video.
- From information visualization to direct manipulation. Scientific video.
- ILOG Discovery is a visualization tool for analyzing data sets intuitively and communicating findings within an enterprise information system. It also serves as an interactive tool for browsing and editing databases, using a direct manipulation paradigm instead of a form-based query system.
- Data-linear visualizations. ILOG research report explaining the model behind Discovery's flexibility.
- Browsing through an information visualization design space. CHI 2004 demo.
- InfoCrible: édition interactive de visualisations compactes. Version française de la démonstration.
- Visualisations compactes: une approche déclarative pour la visualisation d'information. Version française de l'article.
algorithm visualization
08/1998 A reimplementation of Ron Baecker's seminal application "sorting out sorting", which started the domain of algorithm animation. This applet lets you choose sort algorithms and let them race again each other. see more... (fr)